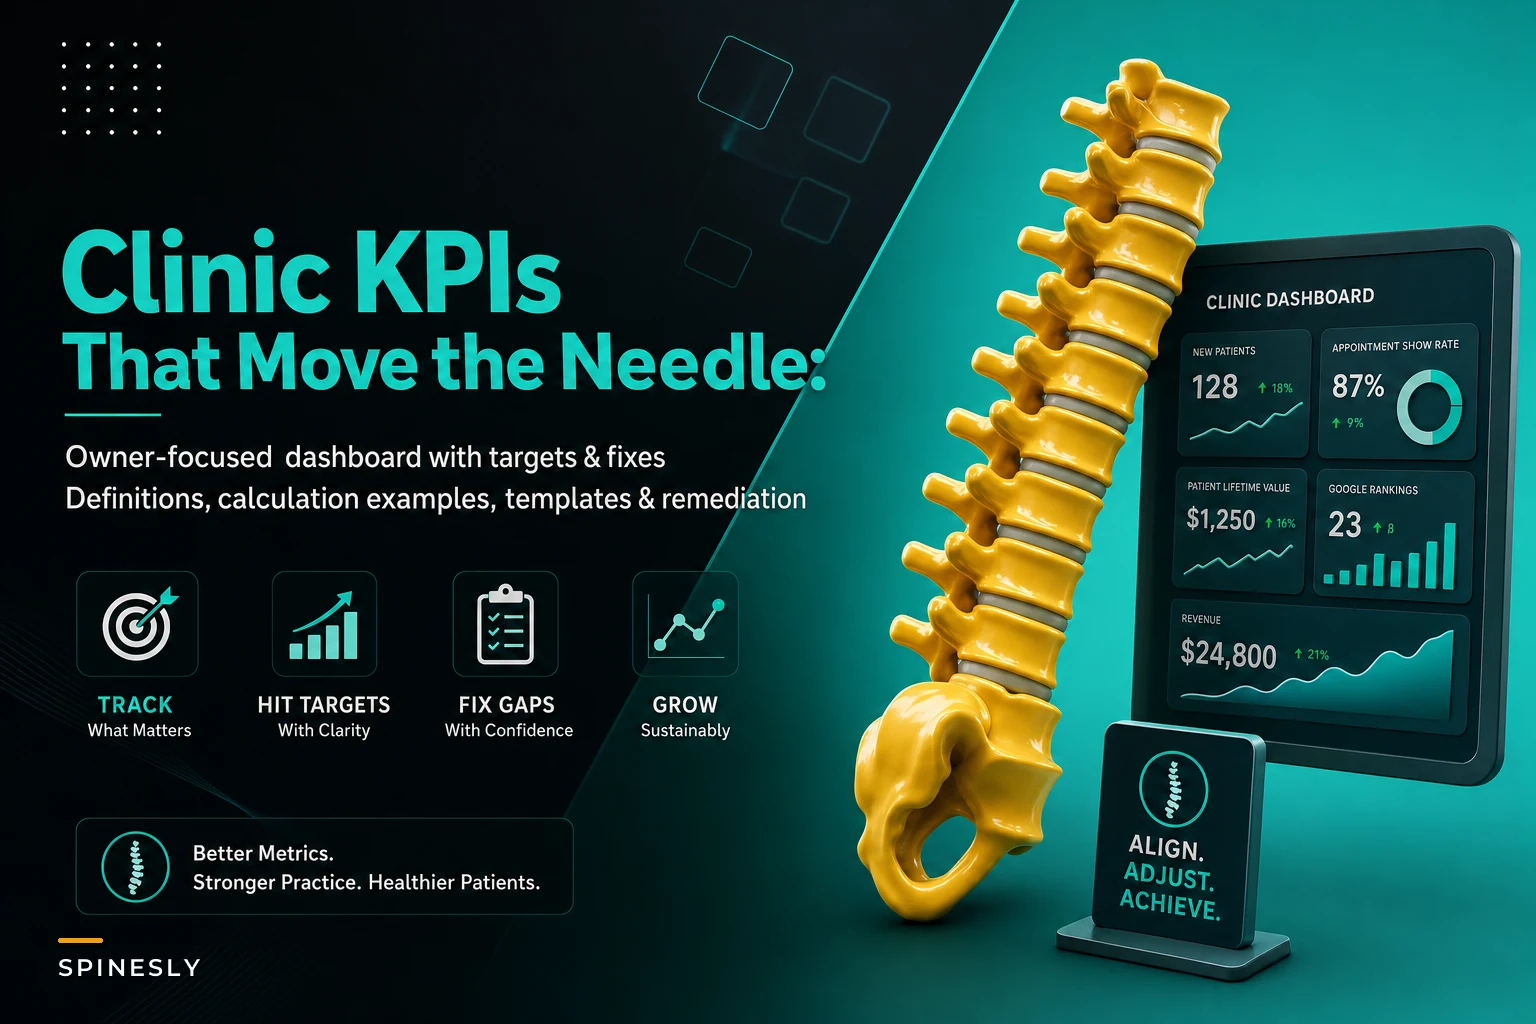

Most chiropractic clinics track the wrong numbers. They obsess over new patient counts while hemorrhaging money through no-shows. They celebrate busy schedules while their average patient visit value drops month after month. They watch revenue grow but somehow profit stays flat.
After working with dozens of chiropractic practices, a pattern emerges. The clinics that actually grow—not just stay busy—track a specific set of operational metrics that directly tie to profit. Not vanity metrics. Not feel-good numbers. Real operational indicators that predict whether you'll be expanding locations next year or struggling to make payroll.
Chiropractic clinic KPIs are different from generic healthcare metrics. Most dashboard templates miss the unique operational reality of running a practice where patient retention matters more than patient volume, where treatment plan completion drives profit more than initial exams, and where your adjustment-to-therapy ratio can make or break your margins.
The Five KPIs That Actually Predict Practice Health
Forget tracking 30 different metrics. Five carefully chosen KPIs tell you everything about your practice's operational health.
| KPI | Target range |
|---|---|
| Treatment Plan Completion Rate | 65-75% for general practice, 70-80% for specialized care |
| Revenue Per Patient Visit (RPPV) | $65-85 for insurance-heavy practices, $95-120 for cash practices |
| Schedule Utilization Rate | 78-85% (higher risks burnout, lower suggests inefficiency) |
| Active Patient Value | $1,200-1,800 for maintenance-focused, $2,000-3,000 for corrective care |
| Collection Efficiency Rate | 94-97% for cash practices, 88-92% for insurance practices |
Each one connects directly to either revenue generation or cost control.
1. Treatment Plan Completion Rate
What it measures: Percentage of patients who complete their full recommended treatment plan versus those who drop off early.
Calculation: (Patients completing 80%+ of recommended visits / Total patients starting treatment plans) × 100
Target range: 65-75% for general practice, 70-80% for specialized care
A practice seeing 200 new patients monthly with a 45% completion rate versus one with 75% completion rate—that's the difference between barely breaking even and clearing $40k+ in additional monthly revenue. Same patient volume, vastly different outcomes.
Where to pull data:
-
Patient management system visit logs
-
Treatment plan records
-
Appointment history reports
Red flag indicators:
-
Completion rate below 50%
-
Declining trend over 3 months
-
Wide variation between providers
Direct fixes when below target:
First, examine your day-3 and day-7 dropout points. These are where most patients mentally check out. If someone misses their third or fourth visit, they're basically gone. Set up check-ins at these critical points—not generic appointment reminders, but specific messages about their progress.
Second, audit your treatment plan presentations. Record a few (with permission) and listen back. Are you explaining the why behind the frequency? Most practitioners focus on what needs fixing but skip explaining why it takes 24 visits instead of 6. Patients don't dropout because they don't believe chiropractic works—they dropout because they don't understand the timeline.
Record a few treatment plan presentations (with permission) and listen back to refine how you explain the timeline and milestones.
Third, implement progress milestones. Every 6 visits, show measurable improvement. Could be range of motion, pain scales, functional assessments—something tangible. Practices that do this see completion rates jump 15-20% within two months.
2. Revenue Per Patient Visit (RPPV)
What it measures: Average revenue generated per completed patient visit, including all services and products.
Calculation: Total monthly revenue / Total completed visits
Target range: $65-85 for insurance-heavy practices, $95-120 for cash practices
Where to pull data:
-
Billing system reports
-
Daily transaction logs
-
Service utilization reports
This metric exposes whether you're running a volume practice or a value practice. A clinic averaging $55 per visit needs 1,800 visits to hit $100k monthly. One averaging $95 needs just 1,050. That's 750 fewer appointments to schedule, document, and manage.
Red flag indicators:
-
RPPV below $60
-
Declining quarter-over-quarter
-
High variance between providers
Direct fixes when below target:
Look at your service mix first. If 90% of visits are adjustment-only, you're leaving money on the table. Not by upselling—by undertreating. Add therapeutic exercises, soft tissue work, or rehab protocols where clinically appropriate. A 15-minute therapy add-on at $25 moves your RPPV significantly.
Review your pricing annually. Most practices haven't touched their fee schedule in years. Even a 5% adjustment across services adds up fast. But stop discounting without strategy. Track every discount given and calculate the impact. One practice discovered they were giving "family courtesy" discounts that cost them $7,000 monthly.
Bundle strategically. Instead of charging per service, create treatment packages. A 12-visit package including adjustments, two therapy sessions, and exercises at $950 performs better than itemized billing both financially and for patient compliance.
3. Schedule Utilization Rate
What it measures: Percentage of available appointment slots that generate revenue.
Calculation: (Revenue-generating appointments / Total available appointment slots) × 100
Target range: 78-85% (higher risks burnout, lower suggests inefficiency)
Where to pull data:
-
Scheduling system reports
-
Provider schedule templates
-
No-show/cancellation logs
Most practices think they're busier than they are. They feel slammed but run at 60% utilization because of gaps, no-shows, and inefficient scheduling. Meanwhile, overhead costs stay the same whether you're at 60% or 85% capacity.
Red flag indicators:
-
Utilization below 70%
-
Wild daily swings (45% Monday, 95% Tuesday)
-
Consistent gaps in prime hours
Direct fixes when below target:
Start with your schedule template. Most clinics use 15-minute slots for everything. But initial exams need 45 minutes, adjustments need 10, and therapy needs 20. Using one slot size for all creates false capacity. Build templates based on actual service times.
Attack no-shows systematically. A 10% no-show rate at 100 visits weekly equals $5,000+ in lost monthly revenue. Implement deposit requirements for new patients, confirmation sequences 48 hours out, and a clear late/no-show policy. Track no-show patterns by day, time, and patient type—you'll find surprising patterns.
Prime time protection matters. Your 10am-2pm and 4pm-6pm slots are gold. Stop scheduling admin time, breaks, or low-value services during these windows. One clinic moved all maintenance adjustments to early morning and late afternoon, opening prime slots for new patients and treatment plans. Utilization jumped 12% without adding hours.
4. Active Patient Value
What it measures: Average lifetime revenue per active patient over a rolling 12-month period.
Calculation: Total revenue from patients seen in last 12 months / Number of unique patients seen
Target range: $1,200-1,800 for maintenance-focused, $2,000-3,000 for corrective care
Where to pull data:
-
Patient revenue reports
-
Visit frequency analysis
-
Service utilization by patient
This tells you whether you're building a practice or running a revolving door. High new patient numbers mean nothing if your active patient value stays low.
Red flag indicators:
-
Value below $1,000
-
Declining year-over-year
-
Top 20% of patients generating 80%+ of revenue
Direct fixes when below target:
Shift focus from new patient acquisition to patient retention. It costs 5-7x more to acquire a new patient than to keep an existing one. Yet most practices spend 90% of marketing budget on new patients and almost nothing on retention.
Create a maintenance program that makes sense clinically and financially. Patients finishing active care need somewhere to go besides "call when it hurts again." Design monthly or bi-monthly programs that maintain progress. Price them attractively—you want steady, predictable revenue more than maximizing per-visit rates.
Reactivation campaigns work if done right. Pull patients who haven't been seen in 90-180 days and check their last chief complaint. Send specific messages about that issue. "How's your lower back been since your last visit in March?" beats generic reactivation messages every time.
5. Collection Efficiency Rate
What it measures: Percentage of billed services actually collected within 90 days.
Calculation: (Amount collected / Amount billed) × 100
Target range: 94-97% for cash practices, 88-92% for insurance practices
Where to pull data:
-
Accounts receivable aging reports
-
Payment posting records
-
Write-off reports
A 5% improvement in collections on $100k monthly billing equals $60,000 annually. That's pure profit since the work is already done.
Red flag indicators:
-
Collection rate below 85%
-
AR over 90 days exceeding 15% of total
-
Rising write-off percentages
Direct fixes when below target:
Fix verification processes first. Most collection problems start at the front desk. If insurance isn't verified properly, you're doing free work. Build a verification checklist that covers eligibility, benefits, visit limits, and authorization requirements. Do this before the patient arrives, not after.
Time-of-service collections matter more than you think. Every dollar not collected at visit time has only a 70% chance of eventual collection. Train staff to ask for payment every single time. Not aggressively, but consistently. "Your portion today is $35. Will that be card or cash?"
For insurance AR, the 30-day mark is critical. Claims untouched at 30 days have half the collection rate of those worked within two weeks. Set up systematic follow-up workflows. Day 15: check claim status. Day 25: call if unpaid. Day 35: determine if appeal needed or write-off appropriate.
You don't need to track 30 things—track these five, understand them, and you can see what's actually moving the needle.
Your Monthly Reporting Template
Building a dashboard means nothing without consistent review. Monthly reporting should take 30 minutes but drive real operational improvements:
Never miss another patient appointment.
Spinesly helps you schedule, confirm, and manage every patient visit efficiently.
- Unified appointment management
- Automated patient reminders
- Staff and resource scheduling
No credit card required
-
Week 1 Review - Pull all five KPI numbers - Compare to previous month and quarter - Identify biggest decline - Choose one fix to implement
-
Week 2 Check-in - Monitor daily the KPI you're fixing - Adjust approach if needed - Document what's working
-
Week 3 Analysis - Calculate month-to-date performance - Project month-end numbers - Identify risks to target
-
Week 4 Planning - Finalize monthly KPI report - Set next month's improvement focus - Assign specific fixes to team members
The template itself should be simple. One page, five numbers, trending arrows, and specific action items. Not a 20-page report nobody reads.
When Manual Tracking Becomes the Bottleneck
Around $150k monthly revenue, manually pulling these numbers starts taking 5-6 hours monthly. Your office manager spends half a day in spreadsheets instead of improving operations. Data lives in three different systems that don't talk to each other. By the time you get the report, it's two weeks old and problems have compounded.
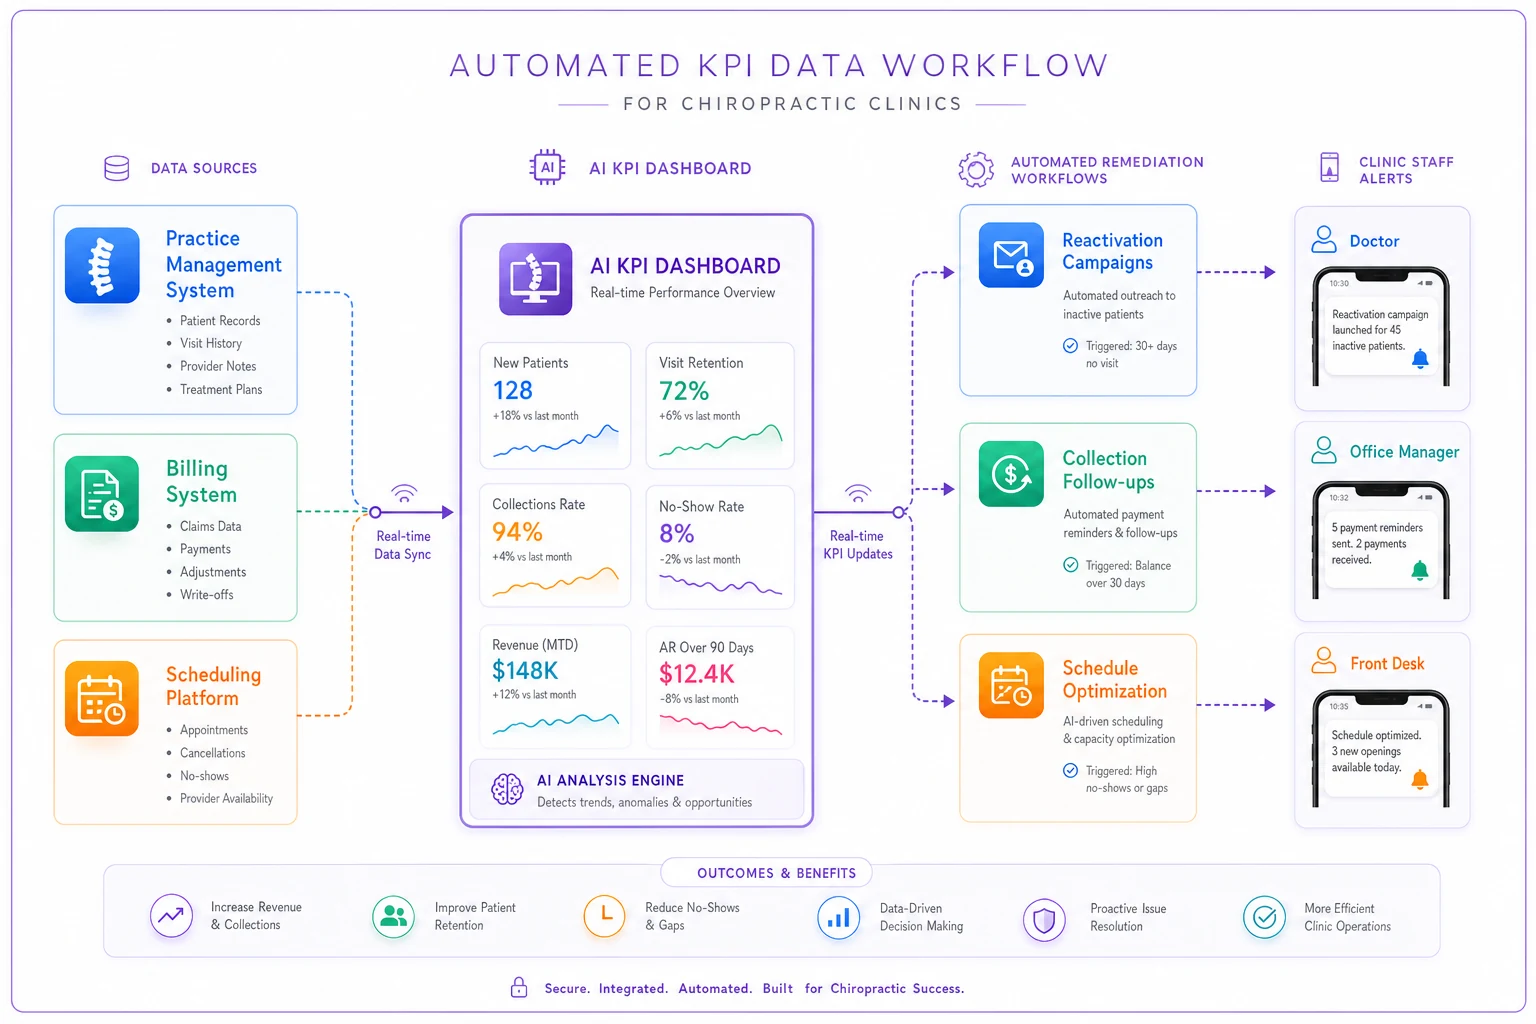
AI-powered operational software changes this completely. Instead of manual calculations, the platform pulls data from your practice management system, billing software, and scheduling platform automatically. KPIs update in real-time. When treatment plan completion drops below 60%, you know immediately, not at month-end. When a provider's RPPV trends down, you can address it before it impacts monthly revenue.
More importantly, AI automation connects KPIs to remediation. Low schedule utilization triggers automated reactivation campaigns to fill gaps. Declining collection rates prompt workflow adjustments and staff retraining modules. The software doesn't just track problems—it helps fix them through intelligent automation that learns from your practice patterns.
But software only amplifies good operational thinking. If you're not clear on which metrics matter and why, no dashboard—manual or automated—will help. Start with understanding these five KPIs deeply. Track them consistently. Fix problems systematically. Then, when manual processes limit your growth, you'll know exactly what to automate.
The Difference Between Busy and Profitable
A chiropractor in Georgia recently shared their numbers. Booked solid, working 50-hour weeks, barely taking home $90k annually. Their problem wasn't patient volume—they had plenty. Their treatment plan completion sat at 35%. RPPV was $52. Collection efficiency barely hit 80%. They were incredibly busy being unprofitable.
Six months after implementing focused KPI tracking and systematic fixes, same patient volume but different results. Completion rate up to 68%. RPPV at $78. Collections at 91%. Take-home increased by $40k annually without adding a single new patient.
That's what happens when you stop measuring vanity metrics and start tracking operational KPIs that directly impact profit. You stop celebrating being busy and start building a practice that actually grows.
The clinics that thrive don't track more metrics—they track the right ones. They don't chase perfect numbers—they consistently improve what matters. They don't wait for month-end reports—they adjust operations weekly based on real-time data.
Your practice doesn't need a complex analytics dashboard. It needs five numbers, tracked consistently, with clear targets and specific fixes for when you miss them. Start there. The rest—whether manual tracking or AI-assisted automation—is just how you execute, not what you execute.
Focus on these five KPIs. Review them monthly. Fix problems immediately. That's how you build a practice that grows predictably instead of hoping this month turns out better than last month.
Ready to streamline your chiropractic clinic operations?
Join 1,200+ clinics using Spinesly to save time, reduce scheduling errors, and improve patient care experiences.