



When a provider's utilization drops, most owners react to the symptom instead of the cause. The chair sat empty three afternoons this week, so the reflex is to blame marketing, or the front desk, or "the economy." Then you spend $800 on a Facebook campaign for a problem that had nothing to do with new patient volume.
The frustrating part is that low utilization almost never has a single cause. It's usually two or three small breakdowns stacking on each other — a recall system that quietly stopped firing, a payer mix shift that pushed reactivations to a slower provider, a schedule template that never got updated after your part-time DC went full-time. Each one alone is survivable. Together they carve 20% off a provider's book and nobody can point to the exact moment it happened.
This piece is built as a diagnostic tree. Instead of listing generic fixes, we're going to isolate five failure modes, give you a fast test to confirm which one you're actually dealing with, and walk through one-week stabilizers and a 30-day rebuild. The goal is triage: figure out what's bleeding, stop it, then repair the underlying system so the same gap doesn't reopen six weeks later.
First, define what "low" even means for that provider
Before you diagnose anything, you need a baseline that isn't your gut feeling. Utilization is booked clinical hours divided by available clinical hours — and the word "available" is where most clinics lie to themselves. If a provider blocks two hours for admin but you count those hours as bookable, your utilization number is artificially low and you'll go chasing a problem that doesn't exist.
A clean baseline: pull the last 8–10 weeks for that specific provider, strip out true blocked time (admin, meetings, approved PTO), and calculate the weekly ratio. A healthy established provider generally runs somewhere in the 78–88% range on bookable hours. A newer provider still building a panel might sit at 55–65% and that's fine — that's not a failure mode, that's a ramp.
The trigger for this whole toolkit is a sustained drop of 12+ points below that provider's own rolling baseline for three or more weeks. One bad week is noise. Three weeks is a system telling you something. If you don't already have provider-level utilization on a dashboard, the owner-focused KPI dashboard breakdown is worth setting up first, because you can't triage a number you're not tracking.
The five failure modes (and the test that isolates each)
Almost every low-utilization event traces back to one of five modes. They look alike from the front desk — an empty column — but they come from completely different parts of the operation. Here's the diagnostic table:
Never miss another patient appointment.
Spinesly helps you schedule, confirm, and manage every patient visit efficiently.
- Unified appointment management
- Automated patient reminders
- Staff and resource scheduling
No credit card required
| Failure Mode | What it looks like | Fastest confirming test | Where the break actually lives |
|---|---|---|---|
| 1. Demand leak | Fewer new + reactivated patients hitting the schedule | Compare new-patient and reactivation counts vs. baseline; is total demand down, or just this provider's share? | Marketing, recall system, referral pipeline |
| 2. Distribution imbalance | Total demand is fine, but it's piling onto other providers | Pull bookings by provider for 4 weeks; is one column starving while others overflow? | Scheduling rules, front-desk booking habits |
| 3. Retention/rebooking gap | Patients complete a visit and don't rebook the next | Measure % of visits that leave with a next appointment booked | Point-of-care rebooking workflow |
| 4. Schedule structure decay | Open slots exist but they're in the wrong shape/time | Overlay demand times against template; are openings at 2pm on Tuesday when patients want 5pm? | Schedule template, not updated after a change |
| 5. Access friction | Patients want in, can't get in easily | Test your own booking flow; count steps, hold time, days-to-third-available | Phones, online booking, confirmation flow |
The single most useful move is running the demand test first. It's a fork in the road. If total clinic demand is holding steady but this provider is soft, you've eliminated the entire marketing conversation and you're looking at modes 2 through 5 — all internal, cheaper to fix, and faster to move. This happens more often than owners expect. The clinic's overall new-patient count is fine, but one provider quietly lost their share because of how the front desk started booking.
Mode 1: Demand leak
This is the one everyone assumes they have, and it's actually the least common in isolation. A true demand leak means fewer people are entering the system, period — new patients and reactivations both down across the whole clinic.
The confirming test: pull new-patient starts and reactivation counts for the last four weeks against your baseline. If both are down clinic-wide, you have a genuine demand problem. If only one provider is affected, skip this section — you have a distribution or retention issue wearing a demand costume.
One-week stabilizer: activate your dormant-patient list. Not a campaign — a list. Patients who were active 6–14 months ago and stopped. A short, specific reach-out ("we had a cancellation open up this week, wanted to check in on that low back issue") reactivates faster than any cold ad. Most clinics have this list buried in their PM system and never work it systematically.
30-day rebuild: put reactivation on a recurring cadence instead of treating it as an emergency valve. Segment by how long they've been gone and why they left, and route those reactivations toward the soft provider first. The clinics that keep utilization stable treat recall as an always-on system, not a fire drill.
Mode 2: Distribution imbalance
This is the sneaky one, and probably the most common cause of a single provider going soft. Total demand is healthy — it's just landing unevenly.
The operational pattern: the front desk develops booking habits. Maybe one provider is easier to book because their preferences are simpler. Maybe a newer staff member defaults to whoever they trained under. Maybe your online booking sends everyone to the first available slot, which consistently belongs to the same two people. Over a few weeks, one column starves while others run at 95%.
The test is fast — pull bookings by provider for four weeks and look at the spread. If your soft provider is at 62% while two others are jammed at 90%+, distribution is your problem, not demand.
One-week stabilizer: give the front desk an explicit rule. New-patient overflow and same-day fills route to the underutilized provider first, unless the patient specifically requests someone else. This alone can move a starved column 8–12 points in a single week because you're redirecting existing demand, not creating new demand.
30-day rebuild: fix the template and the rules that let the imbalance form in the first place. The utilization math and rules for multi-provider clinics covers the load-balancing logic in more depth. The core idea: your booking flow should actively level providers, not just fill the first open slot it finds.
Mode 3: Retention and rebooking gap
Sometimes the schedule isn't soft because people aren't coming in — it's soft because they came in once and left without a next appointment. Every un-rebooked visit is a future empty slot you're manufacturing in real time.
The test: measure the percentage of completed visits that walk out with the next appointment already booked. Healthy is usually north of 80% for active care plans. If your soft provider is sitting at 55%, you've found a leak that's invisible on today's schedule but guarantees next month's gaps.
One-week stabilizer: make the rebook happen at the table or at checkout, not "call us later." The moment a patient leaves without a booked next visit, your rebook rate craters. A simple front-desk script — "Dr. wants to see you Thursday, does morning or afternoon work better?" — assumes the booking instead of asking permission for it.
30-day rebuild: tie rebooking to the care plan so the front desk knows the expected visit cadence for each patient and can flag anyone who slipped through. This is coordination work — the provider's clinical plan and the front desk's booking behavior have to actually connect. When they don't, patients fall out somewhere between the exam room and the parking lot.
Mode 4: Schedule structure decay
This one hides in plain sight. The provider has open slots. Patients want appointments. But the openings and the demand are at completely different times.
A typical example: a provider shifts from four long days to five shorter ones, but the template still has big midday blocks from the old schedule. So now there are open 1pm–3pm windows every day — exactly when working patients can't come — while the 7:30am and 5:30pm slots people actually want are gone. Utilization reads low, but it's a shape problem, not a volume problem.
The test: overlay when patients are actually requesting appointments against where your open slots sit. If your openings cluster in low-demand hours, structure decay is your answer.
One-week stabilizer: reshape the next two weeks manually. Open a couple of early or late slots on the days your demand data says are hot, even if it's just a temporary override. You'll feel it in the booking pattern almost immediately.
30-day rebuild: rebuild the template to match real demand patterns, and set a rule that any change to a provider's hours triggers a template review. Schedule templates rot quietly — every time hours change and the template doesn't, a little more decay sets in. The financial side of aligning chair hours to actual demand and payer mix is worked through in the chair hours and payer mix profit model, which is useful when you're deciding which hours are actually worth opening.
Mode 5: Access friction
The demand exists, the slots exist, but patients can't get through the door easily enough. Phone hold times, a five-step online booking flow, confirmation messages that never go out, days-to-third-available that's crept out to two weeks. Every friction point sheds a few bookings.
The test is uncomfortable but effective: book yourself as a new patient. Call your own line and time the hold. Try your online booking on a phone. Count the steps. Most owners are genuinely surprised — the flow they set up two years ago has accumulated friction nobody ever flagged.
One-week stabilizer: kill the two worst friction points immediately. Usually that's phone abandonment (staff too buried to answer) and a confirmation gap that lets soft bookings evaporate before the patient shows up.
30-day rebuild: get days-to-third-available under your target and tighten the online booking flow. Access friction is a compounding tax — it doesn't show up as one lost patient, it shows up as a steady drip you never see because those people just never became appointments in the first place.
Running the diagnosis: a step-by-step order
Don't test all five at once. Run them in this order, because each one narrows the field:
-
Confirm the baseline drop. Is this provider actually 12+ points below their own rolling baseline for 3+ weeks? If not, stop — it's noise.
-
Run the demand test. Total clinic demand down, or just this provider? This forks you toward external (Mode 1) or internal (Modes 2–5).
-
Check distribution. Pull bookings by provider. Is demand piling elsewhere?
-
Check rebooking rate. What % of completed visits leave with a next appointment?
-
Overlay schedule shape. Do open slots sit in low-demand hours?
-
Test access friction. Book yourself and count the friction.
This flow visualizes the step-by-step order to run the diagnosis.
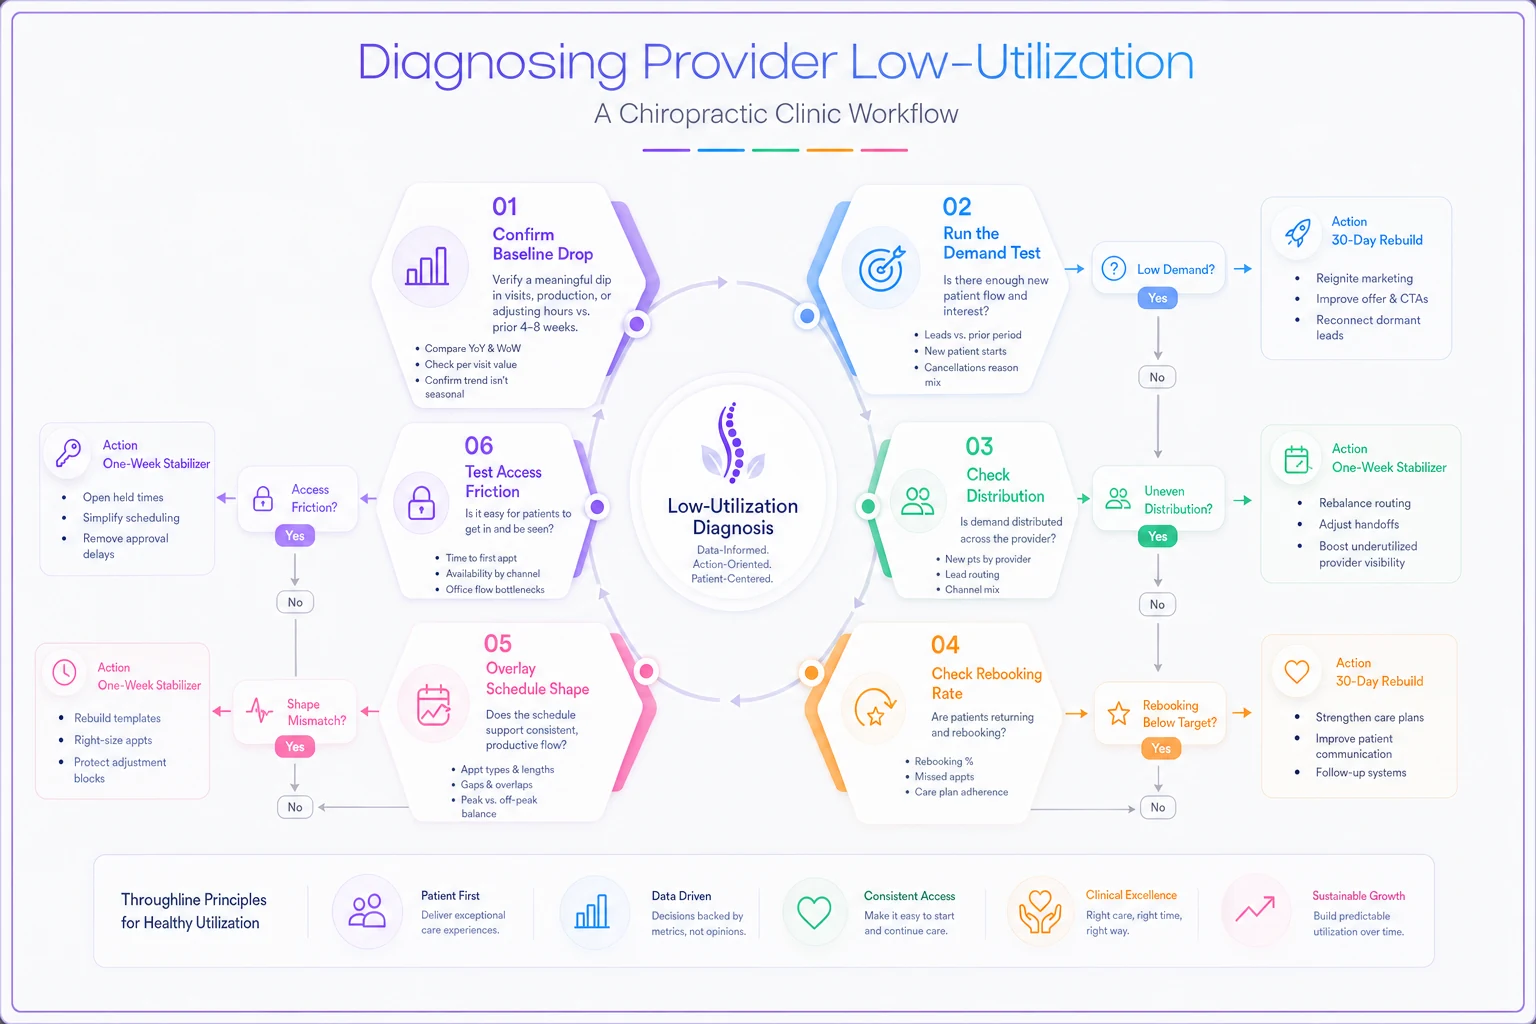
Most low-utilization events resolve into one primary mode and one secondary. Fix the primary in week one, the secondary over the 30-day window. Trying to attack all five simultaneously just means you can't tell which fix actually worked.
A real scenario
A two-provider clinic noticed their newer associate had slid from around 80% utilization down into the low 60s over roughly a month. The owner's first instinct was a marketing push — the associate "needed more patients."
They ran the demand test first. New-patient volume was flat; the clinic wasn't short on demand. A distribution check showed the senior DC running at 92% while the associate sat at 63%. The front desk, without any rule to follow, had been defaulting new patients and same-day fills to the senior provider out of habit. Nobody made a deliberate call. It just drifted.
The one-week fix was a single booking rule: overflow and same-day fills route to the associate first unless the patient requests otherwise. Within two weeks the associate's column moved from the low 60s into the mid-70s. Over the 30-day window they reshaped the associate's template around the early-evening slots patients actually wanted, and utilization settled around 80% — without spending a dollar on new-patient acquisition. The whole thing was a distribution and structure problem masquerading as a demand problem.
Where tooling quietly helps
The reason these events sneak up is that the signals live in separate places — utilization in one report, rebooking rate in another, provider distribution in a third. By the time an owner manually stitches it all together, three weeks have already gone by.
Clinics that catch this early tend to have provider-level utilization, rebooking rates, and booking distribution on one screen, updated automatically, with a flag when any provider drifts below their baseline. That's where AI-powered operational software earns its place — not by making decisions for you, but by catching a 4-point drift before it becomes 14, and routing overflow to the right provider without the front desk having to remember a rule under pressure. The diagnosis stays yours. The tooling just makes sure you're looking at the problem while it's still small.
Pro-tip: surface provider-level utilization, rebooking rates, and booking distribution on one dashboard and set alerts for any provider drifting below baseline.
The diagnosis stays yours. The tooling just makes sure you're looking at the problem while it's still small.
When to run this toolkit — and when not to
Run it when: a provider is sustainably below their own baseline for three-plus weeks, or when you're about to spend money on marketing and haven't confirmed the problem is actually demand. Nine times out of ten the internal diagnostic saves you the ad budget.
Don't bother when: the drop is a single week, the provider is legitimately ramping a new panel, or the softness lines up with a known seasonal dip your whole market feels. Diagnosing a ramp as a failure just demoralizes a new provider who's actually doing fine.
Who should skip the full 30-day rebuild: a solo owner-operator with no distribution to balance. For a single-provider clinic, Mode 2 is irrelevant, and your entire toolkit collapses to demand, rebooking, structure, and access. Simpler system, fewer places to break — but the same discipline of testing before treating still applies.
Pulling it together
Low utilization is rarely a mystery once you stop treating the empty chair as the problem and start treating it as a symptom. The five modes — demand, distribution, retention, structure, access — each live in a different part of the operation, and each has a fast test that tells you whether you're looking at the real cause or a decoy.
Run the demand test first. Isolate the primary mode. Stabilize it inside a week, and rebuild the underlying system over 30 days so the gap doesn't quietly reopen.
The clinics that recover fastest aren't the ones with the best marketing. They're the ones who diagnose before they spend, connect their scheduling, rebooking, and utilization data instead of leaving it scattered across four different reports, and treat provider productivity as a system to maintain rather than a fire to fight every time a column goes soft.
Ready to streamline your chiropractic clinic operations?
Join 1,200+ clinics using Spinesly to save time, reduce scheduling errors, and improve patient care experiences.